Project Overview
Charles River Development is a B2B FinTech company providing software products and services to institutional asset managers. After being acquired in 2018 by the custodial bank State Street Corporation for $2.6 billion, CRD became a focal point of the bank's push to compete with Blackrock Aladdin in the market and create a new revenue stream diversified from their traditional custodial banking services.
Spearheading this new business line was a product, State Street Alpha, that would integrate with CRD's product, an information management system for portfolio managers. Together, they would provide new data warehousing and advanced functional capabilities to help asset managers improve their risk management practices while maximizing returns. Beginning in 2020, Invesco Limited agreed to become our first shared client.
I worked on a cross-functional team to deliver this new flagship product to the client. As part of my responsibilities, I owned the requirements gathering phase and worked cooperatively with engineers, product managers and client stakeholders in order to define a minimum viable product for go-live and a refined product and project roadmap to deliver it. Through this process, I leveraged rapid prototyping coupled with client demos in order to flesh out nuanced UI requirements to ensure that our data-centered product could be leveraged as much as possible to generate investment insights. By understanding our clients processes for constructing financial portfolios and making investment decisions, we were able to successfully define and begin implementation on a satisfactory product for go-live.
The Problems
In order to capture market share, CRD and State Street decided to leverage a number of strategic partners to offer more functionality to clients sooner. As a result, this lead to a multi-lateral project team, with team members spread out between CRD, State Street Alpha, MSCI, Qontigo, Deloitte and others based around the world. My skills developed in diplomacy through my time at the UN were certainly tested!
Complicating this combined effort, we promised to deliver new functionality by developing a new product line. At a high-level, our objective was to replace a legacy software system provided by our competitor in order to provide better and more affordable data and information services to our client so that they could improve their investment performance while optimizing their cost efficiency.
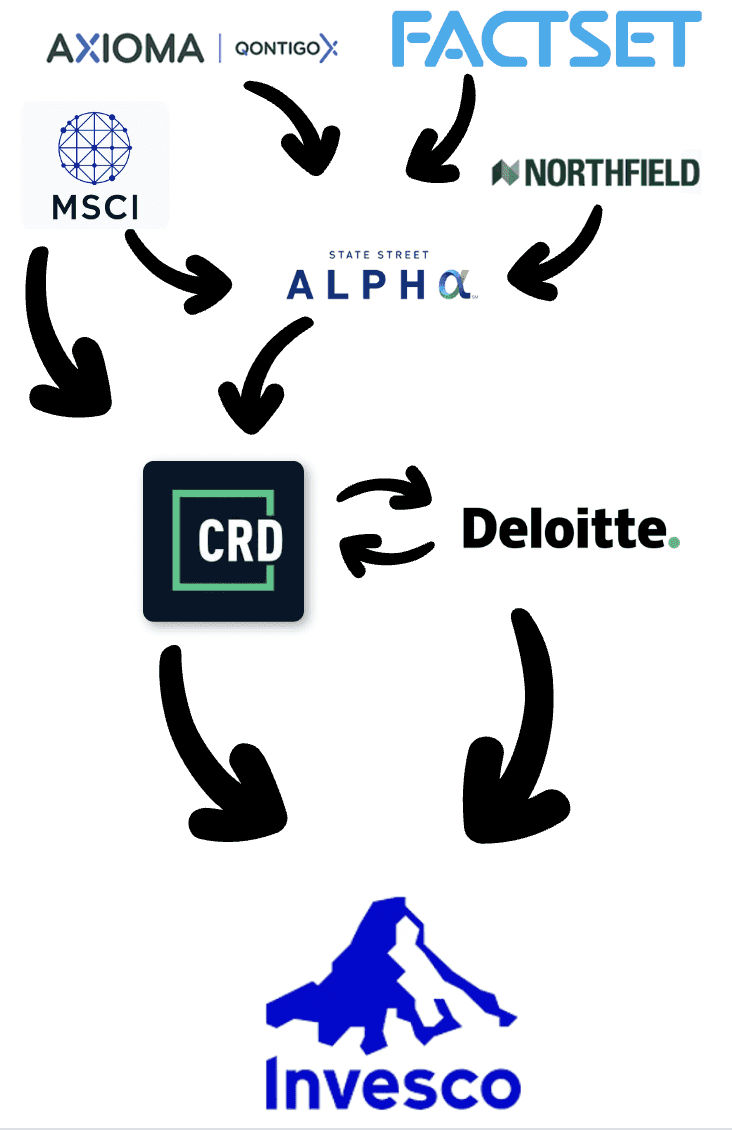
The Proposed Solution
A front-to-back platform that leverages new data warehousing capabilities in order to develop advanced analytics, reports and visualizations on a GUI. This would result in a product that enhances Invesco portfolio and risk managers' capabilities while making them more cost-efficient by supporting all of their vendors in one data warehouse within a consolidated front-end solution for front office users.
The Process
Requirements Gathering:
Over the course of a year, I worked hand-in-hand with clients in order to capture their individual data requirements, workflows and UI needs. This involved interviewing highly specific and technical users, ranging from risk managers, performance analysts, portfolio managers and compliance professionals in order to understand their regulatory and internal constraints.
Additionally, we captured possible workflows with methods such as Wizard of Oz walkthroughs and conducting a thorough gap analysis of our existing capabilities relative to our competitors and the client's ideal target state. This comparative analysis was assisted through a third-party consultancy in cooperation with my team in order to identify core product gaps, customizations needed from our professional service team and where our current functionality supported our client's needs. Once I had collected all of these use cases and properly categorized them for development, we completed the definition of a minimum viable product for go-live.
Developing and Designing the Product:
At first, the initial sales calls and client feedback was aspirational, teasing out what could be possible. After narrowing down key features versus "nice to haves" I was able to assist in advocating for the client and users to influence the product development roadmap.
From there, we took specific functions and features, developed them in short sprints, provided release versions to the client who then evaluated our progress and provided feedback. Working in an agile environment on a cross-functional team, I worked with developers, designers and product managers internally in order to help them prioritize certain capabilities to build into the product. This co-development and co-design process allowed us to ensure that we were consistently on target and delivering a product that met the client's expectations. Additionally, it presented us with some unique UX challenges.
Through a series of divergent and convergent efforts, we were able to work with our partners and client to remove ambiguity, define clear product requirements and then develop a realistic and communicable product and project roadmap to implement a satisfactory minimum viable product.
Implementing and Deploying the Solution:
Given the complexity of the product we were developing, we took on a six-month User Acceptance Testing schedule working with individual users and investment teams in order to ensure that we had the client's buy-in. During this time, we uncovered certain usability issues that we were able to incorporate into our development sprints in order to enhance or correct.
Building Consensus for Go-Live:
Following a thorough UAT process, we prepared to go-live with their equity investment teams with a Phase 1 solution based on a minimum viable product I helped define. In order to gain consensus from the client, we worked with Ernst & Young to come up with a rigorous UAT testing plan, with tests spanning across product functionality to ensure that batches were running in a timely fashion and the appropriate data was being sourced from the correct vendors for proper data warehousing. End users were also involved to ensure that their respective workspaces had the proper UI configurations to make the information required to do their jobs more easily understandable.

Sample Design Decisions
Grid Views:
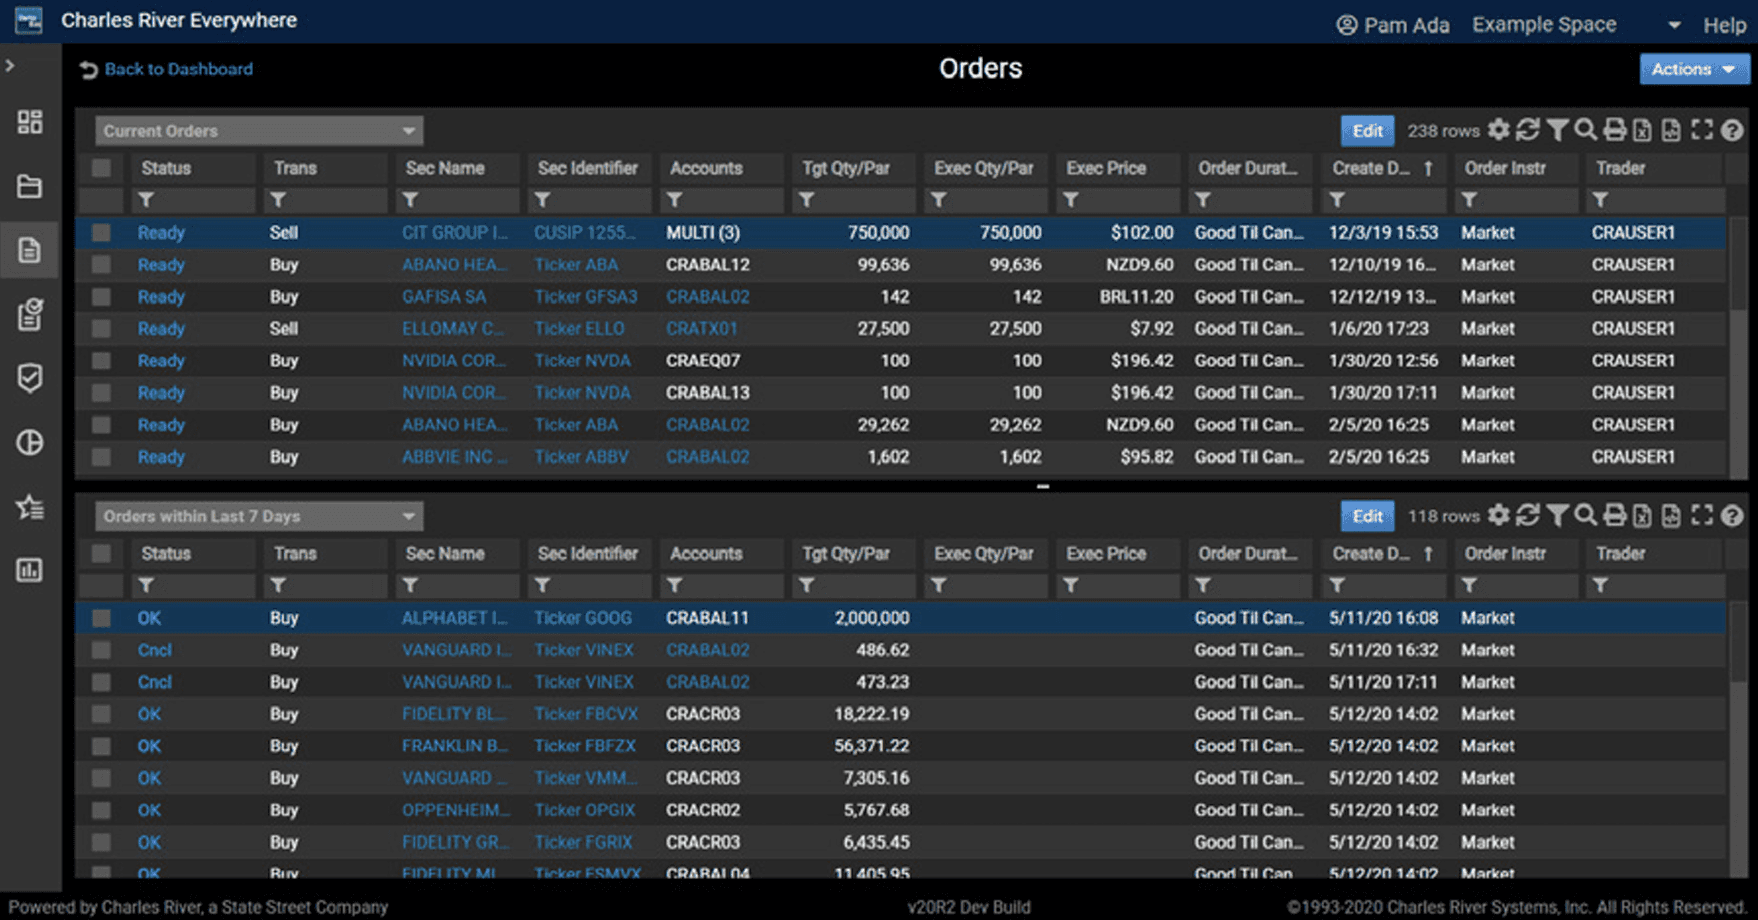
A common design pattern that has been applicable to information management since the dawn of civilization, we employed grids often in our user interfaces. Some strengths of using grid design for our user base was that Grids are very useful for presenting a relatively small amount of primarily static data.
Given some of our users were back office accountants, compliance users or traders looking for orders to execute, having a standard grid design was useful as it could be easily modified to fit the custom needs of any user.
Summative Information and Hierarchy:
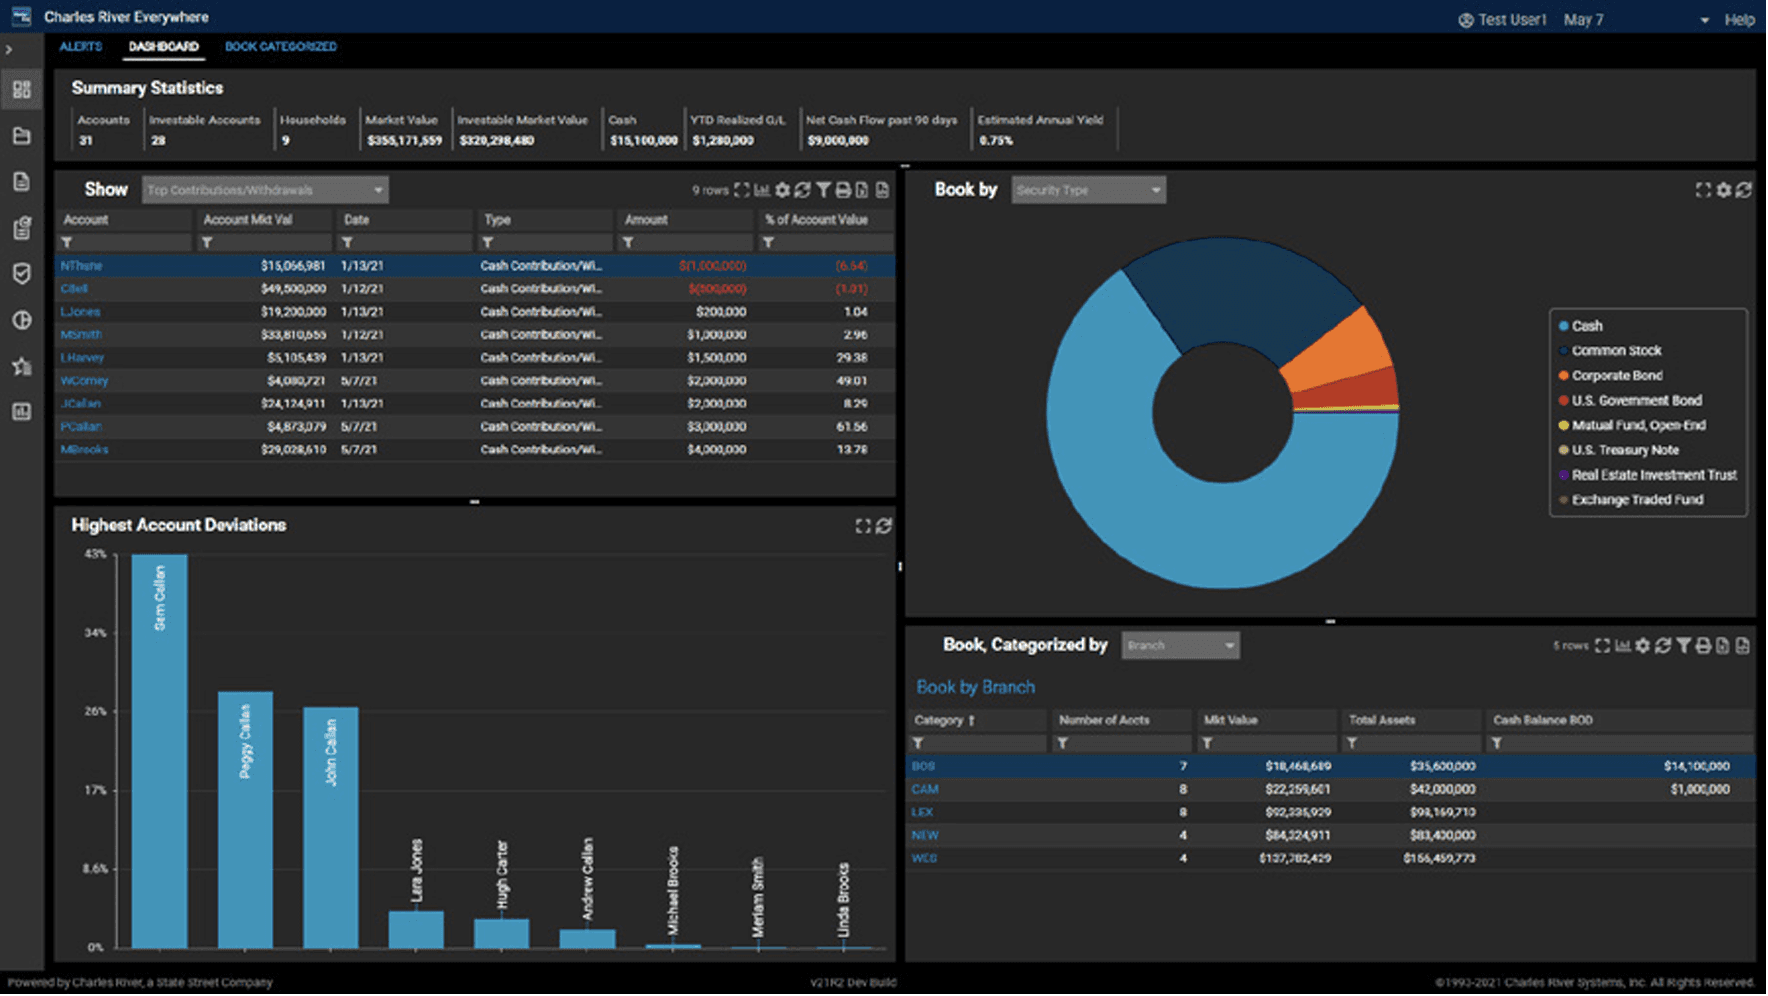
Another common approach we had when constructing user interfaces was having summative information displayed to the user at the top of a given view. This was an application of hierarchy and dominance, putting the most important, portfolio-level information at the top, where it could always be seen.
Shortcuts:
Given the volume and complexity of stock market data as well as the volume of orders and transactions sometimes generated by our clients in a short time, in order to maximize the strengths of our grid design and mitigate its weaknesses (information overload), we included several design components. One example is the inline filters that we have within each column. These filters, combined with other mechanisms that we used, such as grouping data, greatly enhanced users productivity and efficiency when analyzing complex financial data.
Radial Charts:
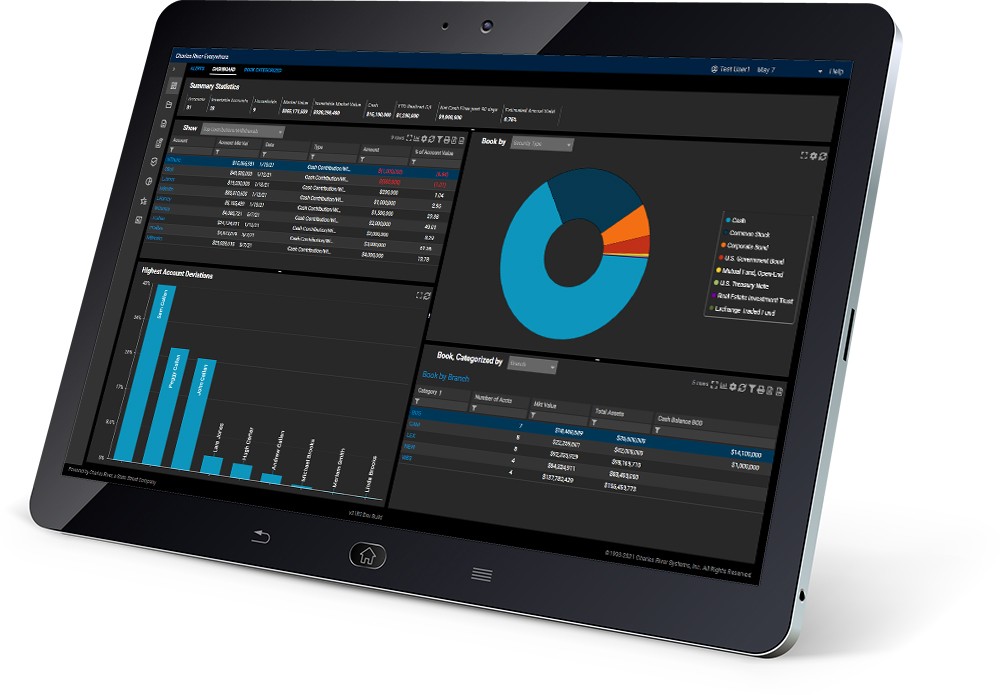
As discussed, the flaw of grid design patterns is the potential for information overload. In order to prevent this, we often combined graphical design interfaces with data visualizations. This worked to simplify the amount of information that a user was processing at a given time. A common way that we would present data visualizations like this was using radial charts, as seen in the bottom image to the left. By using radial charts, we were able to display data-heavy information like portfolio weights, investment allocations and risk exposures to the user in a way that they could process quickly and easily. Using radial charts was an application of Fitts' Law, providing the user with a larger target that they could easily identify for key information that needed to be processed quickly. This was a favored UI component for Portfolio Managers.
The Results
What does "success" look like?
With both successes and setbacks, we were able to define a minimum-viable product for go-live with the client as well as our partners and external consultants. Once an MVP was defined, we set out on an ambitious product roadmap to build it into existence. Through this process, as well as a prolonged UAT period and constant iteration and testing, we were able to converge on an understanding of the requirements for go-live.
At the time of my departure, all individual user interfaces were completed for core users and testing for Service Level Agreements to meet the requirements of our Statement of Work were underway. Phase 1 was expected to go-live in early Q1 of 2024.


